

Is your content trustworthy?
Is your content persuasive?
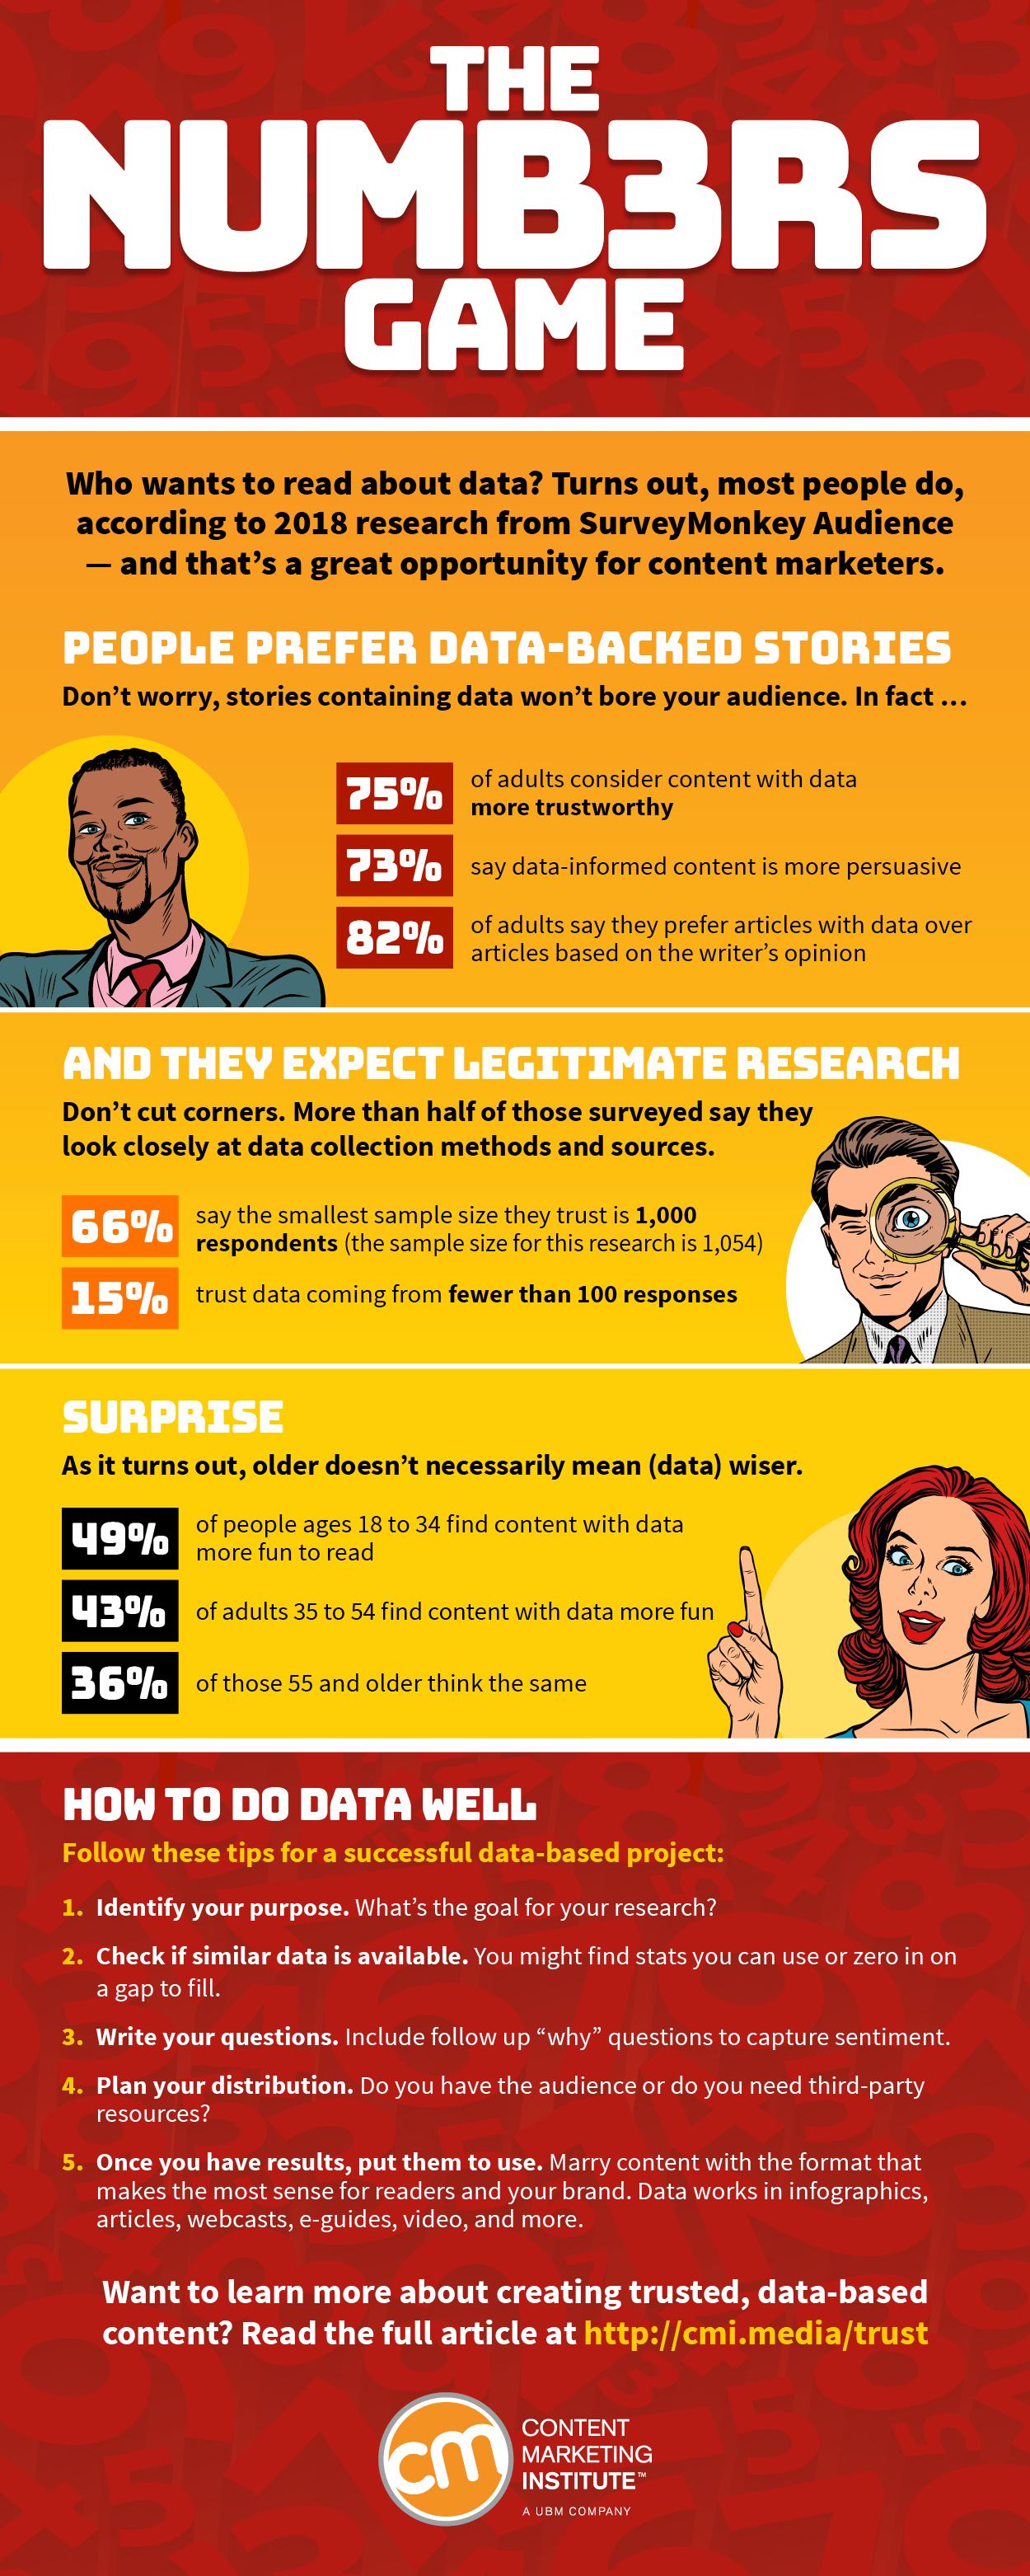
If your content doesn’t include data, it is less likely to be trusted, persuasive, or even read. That’s based on the findings from an August survey of 1,054 U.S. adults released this week by SurveyMonkey Audience:
- Three-fourths of adults say content with data is more trustworthy than content without. (Interestingly, 5% say data-backed content is less trustworthy.)
- Almost three-fourths (73%) say content with data is more persuasive (6% say it’s less persuasive).
- And four out of five U.S. adults (82%) prefer to read an article based on data than one based on the writer’s opinion.
Too often marketers think of data only in the terms of analytics – prescriptive and descriptive data to understand how well content is performing or to inform their content planning. But this research reminds marketers that using data in their content is an audience must-have (or at least a preferred-have).
“When you bring research and data into your content, you’re instantly incorporating voices and perspectives outside your own,” says Morgan Molnar, senior product marketing manager at SurveyMonkey Audience.
When you bring #research into #content, you’re instantly incorporating voices outside your own. @MorganMLehmann Click To TweetData is great, but it should be a component of the bigger picture. “The goal of your research is to be able to tell a compelling story validated with data,” writes Michele Linn, chief strategy officer of Mantis Research. “Constantly ask yourself: Why will someone care?”
Data is great, but it should be a component of the bigger pictures, says @michelelinn. Click To TweetLet’s look at a couple brands using data in effective ways that Morgan shares then delve into how you can use data to create better content for your brand.
HANDPICKED RELATED CONTENT:
- Thinking of Creating Original Research? 8 Things to Consider
- 10 (Mostly) Quick Wins to Steal for Your Original Research Project
Brands doing data right
Do you cheat? That’s the question Netflix posed in 29 countries. The media streaming company asked its audience if they watched new episodes of a series before their partner did.

Instead of creating a static research report from the results, the company created an interactive web experience.
Instead of a static #research report, @Netflix created #interactive web experience on cheating. @anngynn Click To Tweet
In another data-driven project, Netflix surveyed people about their viewing behavior with their pets, turning the results into an infographic:

And an Instagram story:

As an entertainment brand, Netflix naturally lends itself to entertaining survey topics. But even B2B companies can think creatively. Wrike, a B2B project management software company, found a compelling and relatable idea for its research – workers disconnecting during vacation. It pulled together the research into a gated report to generate sales leads.

Put data-based content into your strategy
Lisa Murton Beets, research director of the Content Marketing Institute, says research-backed content requires a commitment. As she writes, “Even though many types of research and survey software are readily available, not just anyone can ‘do research’ successfully.”
Research-backed #content requires a commitment. Not anyone can do #research successfully, says @LisaBeets. Click To TweetThe first step, both Lisa and Morgan say, is to identify your purpose for the research. You need to have a goal.
Then, do your research to see if the data is already available. As Lisa explains, you may find sufficient existing data to inform your content or you may identify a gap that needs to be filled.
If you proceed with your survey, you should identify the questions to be asked. As Morgan advises in SurveyMonkey’s guide, follow up on key questions about “what is happening” with “why” questions. Understanding the sentiment behind “what” responses is important in capturing (and telling) the full and accurate story.
Follow up “what” questions with “why” to learn the sentiments behind the what. @MorganMLehmann @SurveyMonkey Click To TweetThen identify to whom the questions will be posed. Will it be an audience you already have access to or will you need to identify third-party resources?
TIP: Ensure your sample size is at least 1,000. Over half of adults (58%) in the SurveyMonkey Audience survey say they pay close attention to the data collection method or source. And two-thirds (66%) say the smallest sample size they trust is 1,000 respondents (and that’s also a standard expectation because it means a low margin of error [plus or minus 3%] and confident conclusions.) Only 15% would trust data coming from 100 responses or fewer.
Once you’ve collected the data, you can use it in your content. The options are seemingly limitless, though it makes sense to marry the content with the best format (for the reader and for your brand’s objectives.) Options include:
- Blog posts and articles
- E-guides and white papers
- Infographics and interactive graphics
- Twitter chats
- Videos
- Webinars
Depending on the amount and level of data, you should know how your audience prefers to consume data. In the SurveyMonkey research, four in 10 respondents (42%) prefer data visualization – charts, graphs, or infographics, while one-fourth prefer it in tables or grids. Almost one-third (32%) prefer data as part of the text.
Depending on amount & level of data, you should know how your audience prefers to consume data. @anngynn Click To TweetBONUS FINDING: Men prefer table visualizations more than (30% vs. 20%), while women preferred data in text more than men (35% vs. 27%).
If your research is multi-faceted and detailed, consider creating a home base – a landing page or central repository of your data, as Michele Linn advises. She shares this example from Orbit Media’s 2017 Blogger Survey:

Orbit’s co-founder Andy Crestodina believes so strongly in research that he’s said original research is “possibly the most effective marketing tactic.”
Distribution: To gate or not to gate
Given the effort that often goes into data-informed content, brands often ask themselves if the content should be gated (to capture leads) or not (to maximize the number of readers.)
SurveyMonkey found 87% of adults have provided their email address to access content or join a newsletter/blog mailing list. But only one-third (33%) of those who provided an email address report the content as being valuable.
“This is an opportunity for marketers to provide more value to their readers,” Morgan says.
SurveyMonkey analyzed what type of content worked better in securing email addresses. Here are the top findings by type:
- Newsletters and blogs (46%)
- Research reports (28%)
- E-guides (28%)
- Webinars (24%)
BONUS FINDING: Women are more likely than men to provide an email to join a newsletter or blog (51% vs. 40%), while men are more likely than women to provide an email for research reports (32% vs. 25%).
Men are more likely than women to provide an #email address for research reports (32% vs. 25%). @SurveyMonkey Click To TweetOne more surprising result
Almost half (49%) of people ages 18 to 34 say content with data is more fun to read. And more than one-third of adults age 55 and older and 43% of adults 35 to 54 say the same.
“Data doesn’t have to be about boring number crunching and large data tables that make your eyes bleed,” Morgan says. “Data can be confirmatory or it can be surprising and challenge stereotypes.”
Don’t ignore what motivates your audience
It may be easier to write an article sharing your (or your subject matter expert’s) opinion. But recognize, if you publish content without data, you’re missing an opportunity to build trust and/or persuade your audience. And in some cases, you may be missing out on readers altogether.
Share this image on your site
Feel free to share this infographic on your site. If you do, please attribute it to CMI by using this embed code:
To get the latest original research from Content Marketing Institute, make sure to subscribe to the newsletter.
Cover image by Joseph Kalinowski/Content Marketing Institute
