You craft a funnel to take visitors from an introduction to conversion. But does your content actually do that?
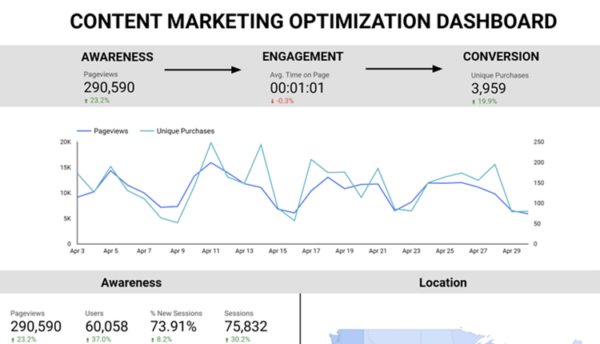
I created a template in Looker Studio (formerly Google Data Studio) you can use to visualize the full-funnel impact of your content marketing initiatives. By looking at awareness (page views), engagement (average time on page), and conversion metrics (unique purchases) together, you can more clearly see the impact of an increase or drop in numbers at any of the stages.
The dashboard works with both Google’s Universal Analytics and Google Analytics 4. But remember, Universal Analytics will stop processing data by July 1, 2023. You can learn about how to switch your analytics to GA4 here.
TIP: If you don’t already have your Google Analytics account integrated with Looker Studio, select “Create data source” and follow these instructions to connect your account.
Step 1: Connect to your data
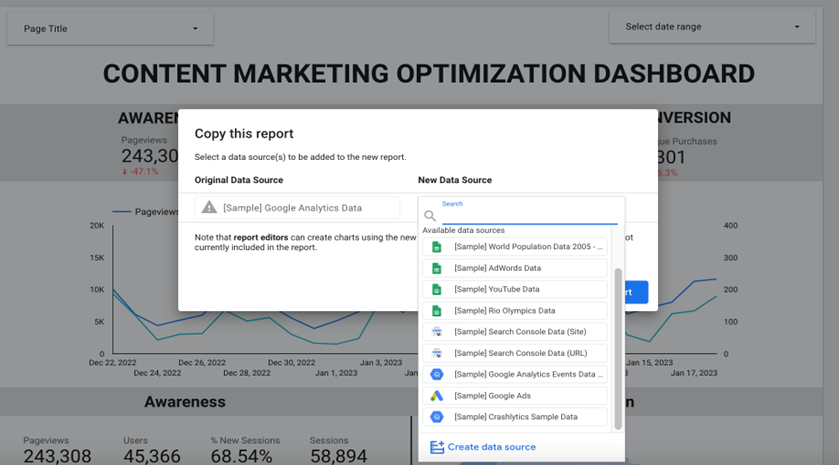
Make a copy of the template to replace the sample data with your own. Click on the three dots in the upper right corner and select “Make a copy.” A pop-up prompting the selection of a data source will appear. Scroll down to “Create data source.” Pick the analytics system you use now.
Step 2: Customize your dashboard
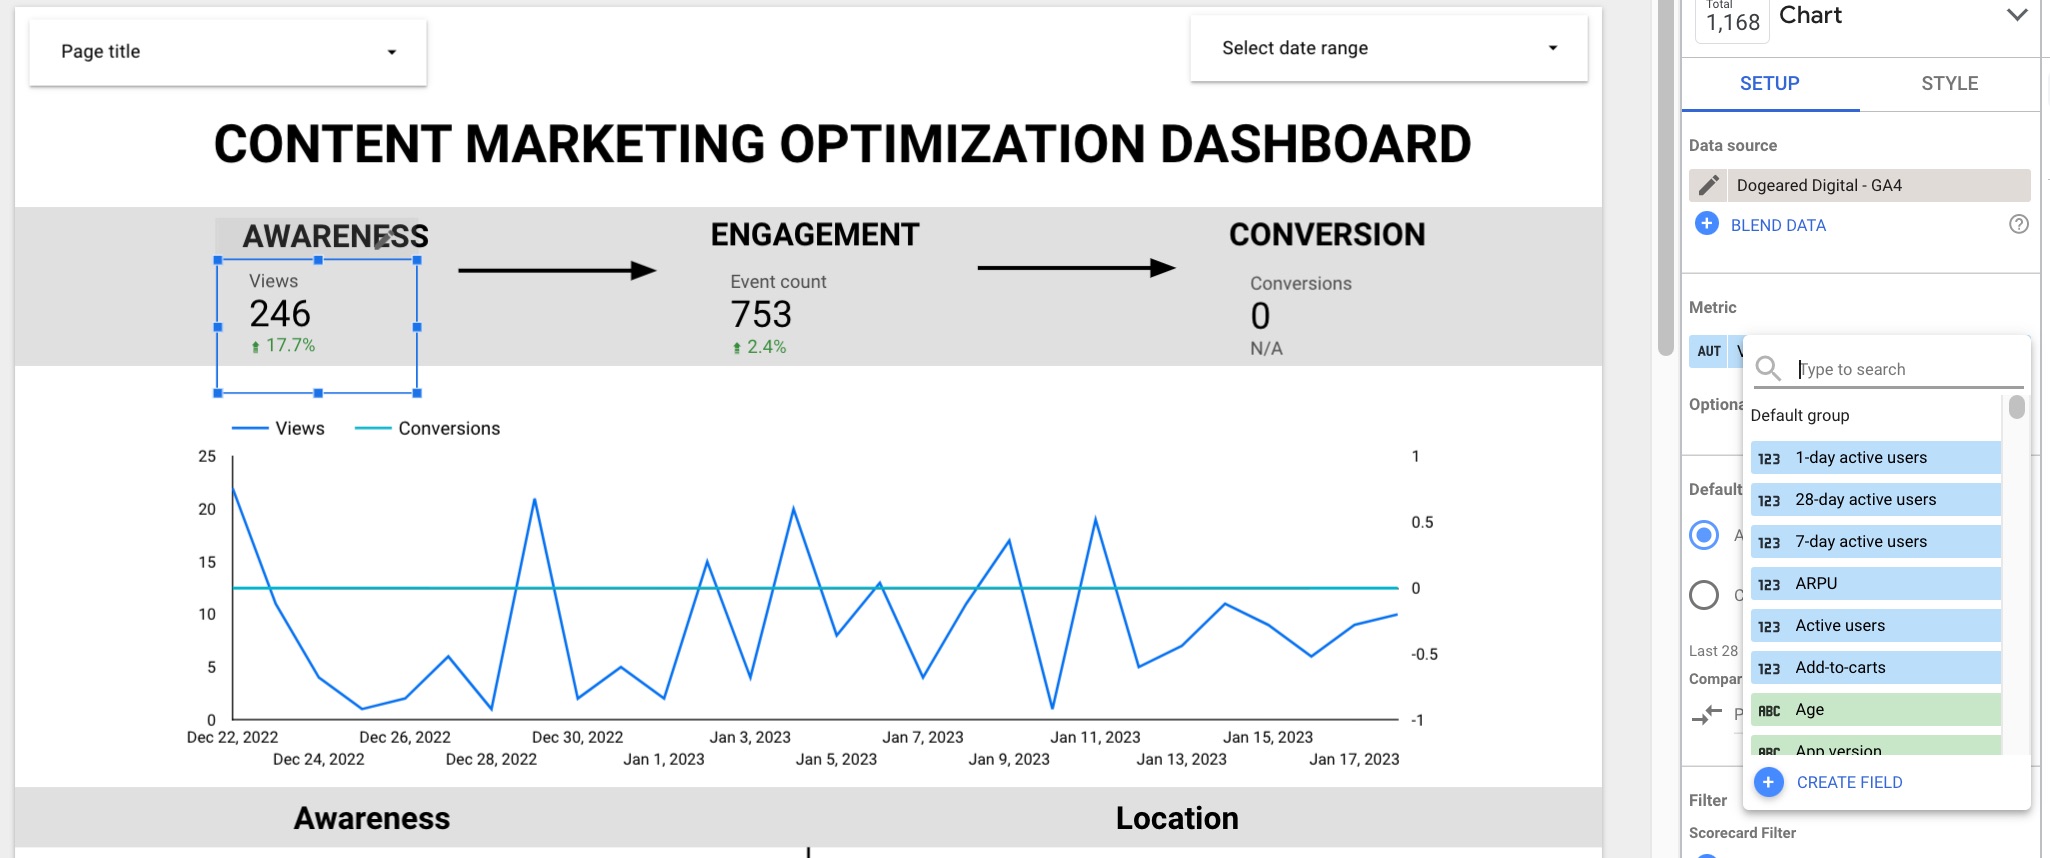
With your data connected, the dashboard automatically shows the awareness and engagement categories based on your Google Analytics metrics.
TIP: Compare your dashboard with the template to ensure the right metrics were selected. In switching the sample data to your own, Looker may have erroneously selected metrics not included in the original template.
You also can visualize different metrics by customizing the dashboard. Click on the metric you want to change and select the preferred metric from the drop-down chart setup menu on the right.
Step 3: Set up custom conversion events
The conversions in the template used custom events in the sample Google Analytics data set – unique purchases, conversion page views, and total value. When you switch to your data source, these metrics will not update.
If you have custom conversion goals and events set up in your Google Analytics account, you can add them to the conversion section as you did with the awareness and engagement sections. However, if not, you should set up conversion events or goals in your Google Analytics account before they can be added to your dashboard by following these instructions.
Some conversion metrics, however, can be created directly in your Looker dashboard with the filter feature. This is particularly useful when you want to set up data just for pages or parts of your website.
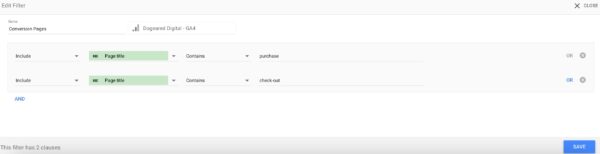
For example, you can add “conversion page views” to your dashboard using this method:
- Click “add a filter” and then “create a filter” in your chart setup menu.
- Select “page title” and add all titles of your conversion pages, such as product pages, shopping carts, booking pages – anything that makes sense for your business. (Visits to pages with conversion intent are more valuable than other page views on your website because they signal the user is considering making a purchase.)
- Name the filter and save it. (My filter is named conversion pages.)
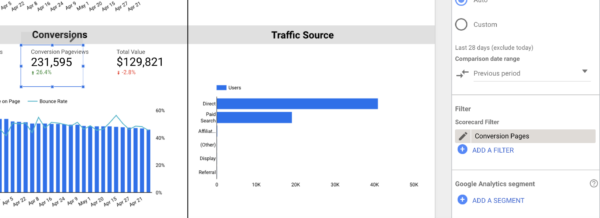
- Select the metric or chart to which you want the filter applied. (I selected “conversion page views.)
- Return to the chart setup menu.
- Scroll down to “filter” and add your newly named conversion pages filter.
You should see the total views for the conversion pages identified in your filter.
View all data for a set of pages
At the top left of the dashboard, click on “page title.” From this drop-down, you can select the pages for which you want to see data in the aggregate. For example, if you want to see your blog posts’ awareness, engagement, and conversion data, you would simply select them here.
With this drop-down menu, you can change the pages on a whim, just like you can change the dates. You also can customize a more permanent view of the report. Say you want the report to show data from your blog posts but don’t want to manually select every newly published post from the drop-down.
Instead, create a filter, which I discussed how to do earlier, or a segment, which you create directly in Google Analytics, which I explain how to do later.
Filters and segments allow you to view a group of pages that fit the designated criteria. Filters are created in Looker to provide a lens on the report level. Segments are created in Google Analytics to isolate and analyze subsets of data based on the designated criteria.
To create a segment in GA4:
- Sign into your Google Analytics account.
- Click on the “Explore” tab in the menu on the left.
- Create or open an existing exploration. A “variables” menu will pop up.
- Select the plus sign next to “segments.”
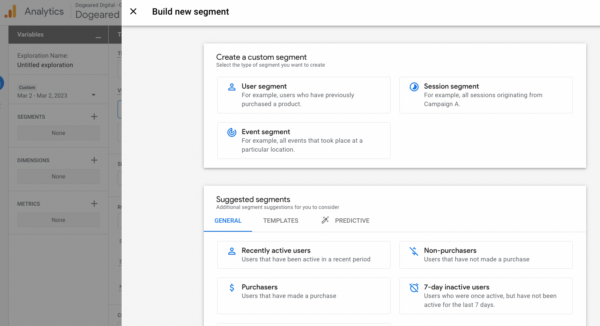
- Create a custom segment or use a suggested segment. (Custom segments require you to isolate data based on users – what specific people have done on your site, sessions – any time someone visits your site or events – when someone has done something specific on your site.
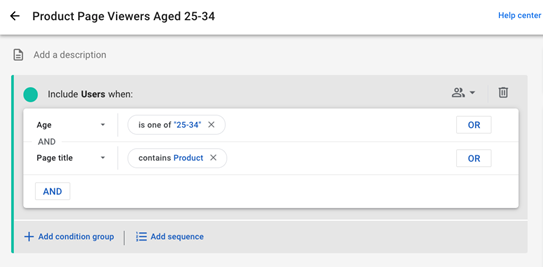
- Add the conditions based on your chosen criteria, such as demographics, traffic source, pages visited, platform, device, etc.
- Use conditional and/or logic to further nuance your segment.
- Name your segment, and you’re all set.
Now, you can apply the filter or segment:
- Go to “Page” on the top menu bar.
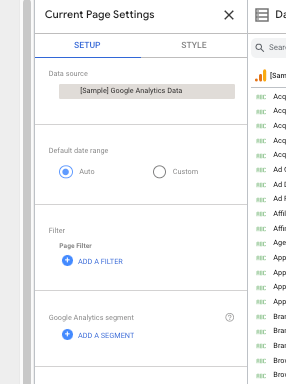
- Select “Current page settings,” and a new panel will open on the right, next to your data source.
- Under the “Page filter”, choose “Add a filter” and apply the chosen segment or filter to your dashboard.
Deriving actionable insights from your dashboard
In this template, the dashboard compares time periods, so you can see how the numbers progress over time. By tracking the early, mid, and late stages of the funnel, you can use the data to optimize your customer journey.
For example, a substantial increase in your awareness and engagement metrics should lead to an increase in conversion metrics. How long that will take depends on the length of your buyer cycle, but ultimately the pattern of growth early in the funnel should consistently correlate to an uptick in conversions. Be sure to note how long the process takes to note patterns in time and behavior in the cycle. The more you know, the better you can optimize for the buyer’s journey.
If the awareness and/or engagement metrics rise, but conversions don’t, you may be attracting people other than prospective buyers to your site. That indicates you may need to change your awareness marketing channels. If the drop occurs at the engagement level, take a hard look at your website content. Why isn’t it sticky? How can you change up your content strategy to entice people to stay and learn more?
Marry content marketing and measurement in 2023
By visualizing your data in this Looker Studio template, your content marketing team will be well-equipped to analyze which content attracts visitors and how it impacts their buying decisions. By building that connection – and having a visual representation of it – your executive team will be more likely to support the content marketing strategy. And that’s not an optional step in 2023.
HANDPICKED RELATED CONTENT:
- Forget Views and Shares: Choose Metrics More Relevant to Your Content Marketing Goals
- Where Should Your Customer Journey Start? [New Demand Generation Research]
- 6 Things You’re Doing Wrong With Website Content Optimization
- How To Build an Impactful Content Dashboard With Google Looker: A Step-by-Step Guide [Free Template]
Cover image by Joseph Kalinowski/Content Marketing Institute
