
Editor’s note: We’ve updated this post with a new version.
Part of keeping people productive is ensuring that deadlines are set, but it’s not enough to simply state due dates. Employees need a constant and visual reminder of what needs to be accomplished and when it needs to be done.
You’ve probably heard it, but many studies prove visual cues can greatly increase the likelihood of information recall and comprehension of new subject matter.
Without being able to envision what that process looks like, it becomes difficult to fully comprehend what is required for success. Take these steps for visualizing your strategies to become more productive in your (and your team’s) day-to-day life.
Creating a visual of your strategy
I don’t know about you but when I get asked, “What’s the strategy for accomplishing x,” I immediately feel anxious.
It’s not because I don’t know the strategy, but because it’s such a broad question. The answer is not always straightforward. It’s silly of me to expect my team to remember a strategy I explain or email in text. It’s too overwhelming and too dense to fully retain.
It’s silly to expect your team to remember a strategy you verbalize or email, says @NadyaKhoja. #visualcontent Click To TweetI visualize every important component of the strategy so everybody is on the same page with a clear understanding of what’s expected of them and of the team.
Step 1: Visualize your high-level yearly goals
It’s important to start at the end – identify the main goal your team should strive to achieve.
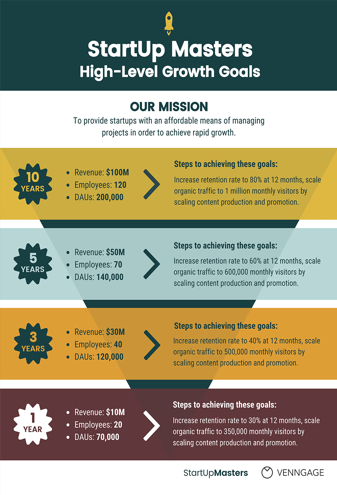
I like to start with a template or outline like the image above. It sets general expectations for the year and lays out the growth strategy with important metrics that could influence that goal.
The high-level growth goals for the hypothetical StartUp Masters – which has a mission of providing startups with an affordable means of managing projects in order to achieve rapid growth – are clearly shown. The goals are broken down to depict success in year 10, five, three, and one.
Not only are the year-specific goals highlighted, but each includes the factors that will influence revenue and daily active user numbers.
Print your goals and post them around your workspace or office so everybody is clear on the company’s targets.
Print your goals & post them around your office so everybody is clear on the company’s targets. @NadyaKhoja Click To TweetStep 2: Identify and plot projects on a visual road map
Now, you need to show your team how they might get to those high-level goals.
Chances are your strategy incorporates projects that will influence the metrics that matter. And setting deadlines and milestones is important for these projects too.
Here’s an example of a basic product road map:

Each team’s projects are detailed by quarter. It gives an immediate visual cue of start and end dates for each project.
In this example, the web team can see that the new admin console must be completed by the end of January, and the second project – third-party integration – likely can’t start until the first project is completed.
For the marketing team, however, projects are less dependent on each other, enabling simultaneous work and completion.
Now, you might be thinking, “Well, can’t I just document this in a spreadsheet and it has the same effect?”
Yes, you can. However, it is more complicated to fully comprehend when projects overlap or project steps are completed.
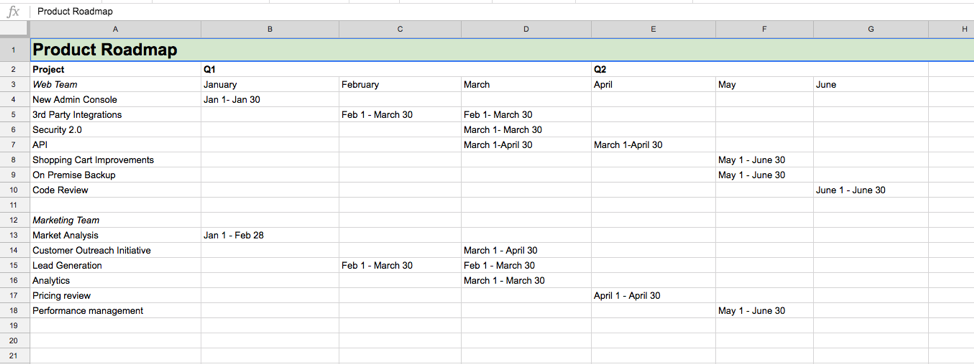
Here’s a look at the above road map in a spreadsheet form:
Which one stands out? Which one do you think you’re more likely to recall faster? Chances are it’s the visual road map because the information is organized in a more structured manner. You can see the progression as a timeline.
A spreadsheet isn’t good enough. You need a #visual road map for your strategy, says @NadyaKhoja. Click To TweetNow the reality is, your projects may be complicated and your road map might look more like this:

In this example, projects are color coordinated and broken into milestones with key actions listed per project or workflow. A document or a spreadsheet outlining this information is overwhelming for management and individual contributors to understand.
As an evangelist for your company’s marketing strategy, using a high-level visual representation is a powerful way to secure buy-in and comprehension for your strategy.
TIP: Use textual hierarchy, engaging color schemes, and summarize your information for better readability.
HANDPICKED RELATED CONTENT:
Step 3: Get individual team members to visualize their contributions
We all know consistent reflection and journaling are great ways to remember and process new information. But documenting that information in a visual manner not only improves information recall, but it also can make it easier to organize your thoughts and ideas.
To ensure that your team members are actively working toward their goals and to promote job ownership, getting them to visualize their contributions using various marketing report templates is a great start.
I do this in a couple ways with my team. The first is to improve their personal development and the second is to ensure that they remain organized and execute their tasks efficiently.
For personal development, each person chooses an area of marketing in which they want to improve their skills, such as technical SEO. They work in 90-day sprints and focus on mastering one aspect of that marketing area. They outline all the major aspects to create a mind-map template to visualize and organize what they should be learning:

In doing so, they can pinpoint the inputs required in a set amount of time. It allows them to break down a general concept into achievable milestones. By doing this work, they are more focused and aware of what is manageable.
The next is to break down those milestones into tasks using a checklist template similar to this:

Not only does this force team members to think strategically about what they need to do to hit their goals, but they also have a visual reminder of deadlines to keep them motivated and productive.
Break down goals into milestones in a visualized strategy, says @NadyaKhoja. Read more>> Click To TweetIn addition, all team members can see what their colleagues are working toward – holding every individual accountable for what they stated they would do.
Conclusion
Using a strong visualized strategy that allows every team member to contribute their involvement is an effective way to keep employees motivated. Not only does a visualized strategy make a team more productive, but it also fosters a sense of personal accountability and a mindset to value growth.
Visual reminders are a useful way to reinforce important aspects of your high-level strategy so that everyone is on the same page. Rather than bombarding your team with text-heavy spreadsheets and documents, let them see what they need to do and when they need to do it. You’ll quickly see your output is of a higher quality that happens faster and more consistently.
Cover image by Joseph Kalinowski/Content Marketing Institute
