Original research projects are a fantastic way to build authority and demonstrate thought leadership. I’ve been recommending them to my clients for years.
For a long time, I wanted to do one of my own – creating a content brand I can build on over time. This past year, I finally did it – The State of Writing 2020. And boy, did I learn a few things, not the least of which is that original research provides a good ROI.
Published in February 2020, the report was a culmination of more than a year’s work. I had two main goals:
- To increase the authority for our company’s website
- To increase email subscriptions to the company newsletter
The process was harder than anticipated. I’m used to analyzing other people’s research, but that’s nothing like what it takes to produce your own. Here are some of the big lessons I learned.
I’m used to analyzing #research, but producing it on your own is a lot harder than I expected, says @SarahMitchellOz via @cmicontent. Click To Tweet1. Find a topic no one else is researching
My company, Typeset, specializes in editorial services. While there is a lot of research and opinion about what makes great writing, I know great writing isn’t enough to ensure that content performs well. After all, the internet is littered with excellent writing no one ever reads.
Why does some content perform well while other pieces flop? What can businesses and marketers do to get a better return on their writing investment?
My partner, Dan Hatch, and I knew a lot of content creation (both in-house and through agencies) could be improved with editorial rigor. We landed on our research question: What makes your writing as effective as possible for your business?
TIP: If you can distill your topic into a single question, you’re on the right track.
Distill your #research topic into a single question, says @SarahMitchellOz via @cmicontent. Click To TweetHANDPICKED RELATED CONTENT:
2. Involve research experts
I got to work listing the survey questions. But when I completed the survey, it took me 25 minutes to answer all the questions – way too long.
I needed expert help. I got in touch with Michele Linn at Mantis Research. While I knew I was struggling with survey questions, I had yet to appreciate how much work is involved in getting a survey from concept to publication – project management, budget, production, etc.
By partnering with a third-party research firm, I could be involved as much or as little as I wanted. A research partner also better understands the commercial value of original research, from designing the report and making plans for publishing to distribution. Without that involvement, I would have missed or discovered opportunities too late to implement in the inaugural report.
3. Expect hard work to get survey responses
I didn’t appreciate that getting responses is not as simple as sending out an email request, especially for a young company with a minuscule email list.
Instead of running the survey for three to four weeks, it was kept open for two months to attract a viable sample size.
Since the research wasn’t based on a random sample, I found that the best success in getting survey responses came from direct asks. Finding a partner to promote the survey to their network or email list also is invaluable. Next year, I plan to add a call to action in the published report to remind people to take the survey the following year.
Finding a partner to promote your survey to their network or email list is invaluable, says @SarahMitchellOz via @cmicontent. Click To TweetTIP: People who “like” or share a survey-request post on social media do not necessarily fill out the survey.
4. Make momentum your friend
Keeping the survey open an additional month cost dearly. By the time we had collected the data, analyzed the storytelling opportunities, and decided on a report format, it was the end of November. Being so close to the holidays, we waited to write the report until our work’s quiet period between Christmas and New Year’s Eve.
Leaving a month gap between assessing the results and writing the report was a mistake. What seemed clear in the data at the end of November was no longer top of mind in late December. I had to refamiliarize myself with the data and the nuances we wanted to report.
The long gap between the survey’s closing and the report’s production made the writing unnecessarily difficult. At a minimum, I’ll reserve a week for planning, a week for building assets (more on that later), and two weeks to write the report next year.
TIP: Ensure that your plan provides the necessary time to work on each step to keep the momentum going.
5. Find a story to tell
One area I had not considered before working with Mantis was the importance of finding the story I wanted to tell from the data.
Find a story to tell from your survey data, says @SarahMitchellOz via @cmicontent. Click To TweetGoing into the project, I focused on the information I wanted to collect. I hadn’t considered the work needed to distill it into something useful for our target audience – business communicators.
When the results showed that less than half of respondents think their content is effective, we knew that was the story to tell.
Having a story gives people something to hook onto, to get them interested, and gives them the promise of something useful to take back to their businesses. It goes a long way to building interest in your project.
TIP: Slice the results to view the data from different angles (e.g., B2B companies vs. B2C companies, large companies vs. small companies).
TIP: Don’t forget data not used to tell the primary story. There’s gold in those “leftovers,” which are a legitimate source of information to fuel an ongoing content program.
6. Don’t bend the research to fit your goals
As copywriters and journalists for 20 years, Dan and I thought we had a good idea of where people fell down on writing effectively. Some of our preconceived notions were confirmed by the research results, but some were not.
We also would have been ecstatic if all the results concluded in opportunities for our company to generate revenue. But they didn’t.
We committed to publishing research that would be as objective as possible. We had to accept that not everything we learned was great news for our business.
That commitment, though, also gave us the ability to speak with authority and objectivity, which goes a long way toward building trust and positioning us as subject matter experts, and contributing indirectly to a financial ROI.
7. Design the report smartly
Visualizing stats in a way that made sense to our audience didn’t happen naturally. After several tries, I created prototype charts in Microsoft Excel, which made a lot more sense to my designer, Jeremy Stewart of Studio JS. Once I did that, the report came together easily.
The designer pushed ways to make the report more usable and easier to read. That meant cutting out text, a painful undertaking for a writer. The final product was more streamlined and straightforward than I imagined it.
To help achieve one of our goals – to improve website domain authority – we added a hyperlink to the original post on every page with a graph and a URL on each shareable graphic.
TIP: Resize all graphics for social sharing and easy inclusion in third-party articles and blog posts.
The final report was created as a PDF, which was loaded to SlideShare and embedded as a viewer in the report launch blog post. That kept people on our website and gave us the chance to provide additional analysis and opinion, provide resources for readers, and drive email subscriptions in the blog post’s CTA.
Most importantly, Jeremy designed the report with a view toward building a content brand for State of Writing reports. We spent a lot of time working on colors and how to represent groups of data. The templates gave the report a polished look that we can easily build upon in coming years.
TIP: Bring a designer into the project as early as possible. Give them time to understand the data.
Bring a designer into your survey project as early as possible, says @SarahMitchellOz via @cmicontent. Click To TweetHANDPICKED RELATED CONTENT:
8. Document the project strategy
With a project of this size, we needed to get the plan in writing to make sure we didn’t miss any tricks. The two-pronged strategy focused on (1) getting survey responses and (2) marketing the research results.
I tracked the moving pieces on a spreadsheet in Google. Each tab dealt with a part of the project:
- Survey target audience outreach (marketers)
- Survey secondary audience outreach (small business owners who often do their own marketing)
- Industry influencer outreach to help promote the research
- Distribution partners, including media, to help promote the research
- Amplification plan to market the research report
- New blog posts
- Existing company blog posts to be updated
- Newsletters
- New content/downloads for our website
- Guest blog posts
- Data graphics for sharing
- PR/media plan
- Launch materials
- Research report
- Press release
- Data graphics
- Thank-you page
- Landing page
- Record of backlinks to research report (goal achievement)
Our library of marketing assets included:
- Note to our email database asking them to take the survey
- Note to ask individuals to complete the survey delivered through email or LinkedIn
- Scheduled social media posts for Twitter, LinkedIn, and Facebook
- Email signatures for both the survey request and the report
- Follow-up email to survey participants with highlights and an early link to the report
- Email for influencers, announcing key findings and including a link to the media kit
- Media kit hosted in an easily shareable Dropbox folder:
- Press releases (Australia and United States)
- Company logos (standard and social media)
- Headshots of key people in report
- Research images (report cover and data graphics)
- Press release for survey launch
- Press release for report launch
TIP: Based on Mantis’ advice, we developed some assets in advance to efficiently manage getting survey responses and promoting the results.
In the end, I wrote an email to each survey respondent to let them know the final report was available. It took a day, but it also gave me an opportunity to start a personal conversation. I hope this investment leads to a good response rate for future surveys.
HANDPICKED RELATED CONTENT:
Early results are in
We launched State of Writing on Feb. 19, exactly one month before the COVID-19 lockdown started in Australia (where I am based). That goes to show even the best-laid plans can be derailed.
As expected, the blog post announcing our report attracted a lot of traffic and quickly shot up to the most-viewed URL on our site. The average length of time on page for the post was 5 minutes 37 seconds, which indicates people were reading.
It’s hard to say what the results would have been had we been operating in a business-as-usual environment, but I can report on the first-month impact:
Goal 1: Increase authority for company website
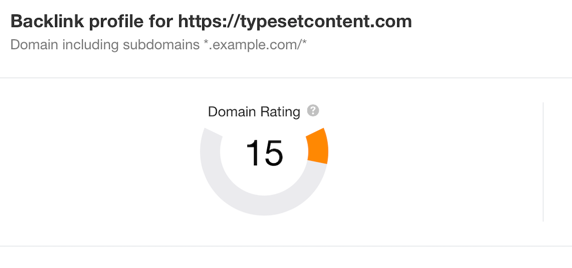
On Feb. 16, the domain authority rating was 15 on the almost year-old site.
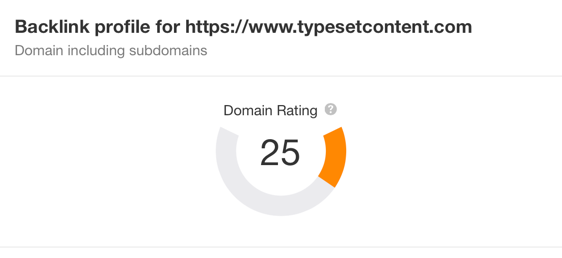
On March 18, the site’s domain rating was 25. That’s a quick win of 10 percentage points or a 67% increase in domain authority.
In addition, backlinks and referring sites leapt and remain high:

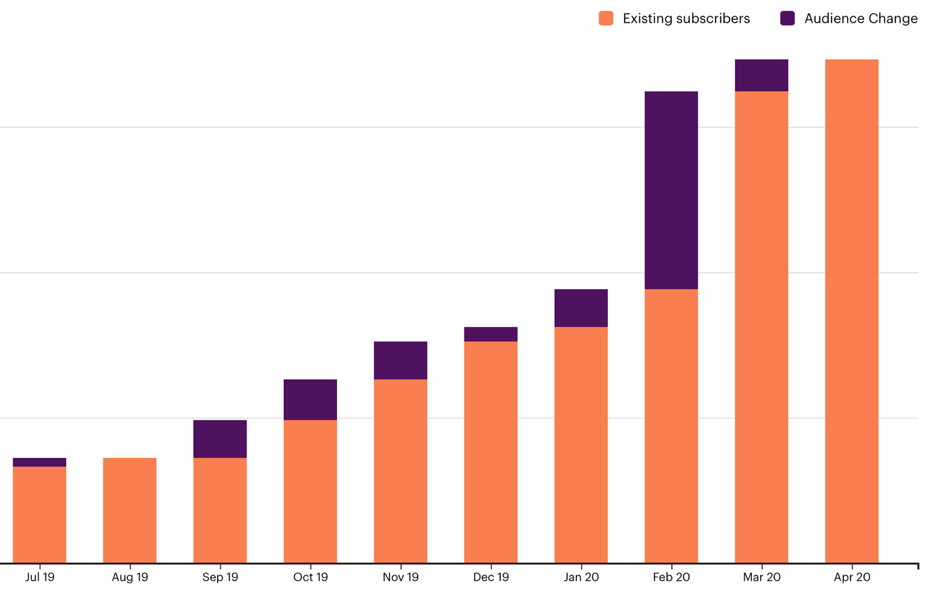
Goal 2: Increase email subscriptions
Our email subscription rate was more impressive. Between Feb. 1 and April 1, it increased by 84%. Throughout the report, the call to action was to subscribe to our newsletter, so this represents a massive win.
TIP: Keep marketing the research. We planned six subsequent supporting blog posts and an equal number of newsletters.
TIP: Be flexible. I used the cover artwork on social media for a couple of days before the report dropped. After the release, I wasn’t getting as much social engagement on the actual report. I changed the cover image in the posts, even using stock images in some. Engagement increased. I assume people who saw the “coming soon” post bypassed the actual research post because the images were the same.
Final thoughts on conducting original research for your business
Original research is hard work, but it’s exhilarating to provide a new depth of information to your industry. Having a good strategy and research partner is essential. It’s also vital that your leadership supports the project because it can be all-consuming for some members of your team.
Though time is the biggest investment, you also need to invest in a research partner and graphic designer if you don’t have them on staff. These two expenses ensure more than anything that you end up with a credible and consumable report. And, if you take a long-term approach to the research, these costs are reduced in coming years as you build upon past results instead of inventing new research.
The initial return on investment on our original research is proving to be more fruitful than any other marketing we’ve done. Our online advertising and SEO campaigns have cost roughly the same and delivered comparatively little return.
The State of Writing 2020 research also has provided a wealth of data for future blog posts and newsletters, all of which become a long-term asset of our company. If all goes according to plan, State of Writing will become a long-running content brand for years to come.
Most of all, the research means we know for certain the areas in our industry that need addressing. That valuable intelligence can help us develop and enhance our product offerings.
HANDPICKED RELATED CONTENT:
Cover image by Joseph Kalinowski/Content Marketing Institute

