

How do you measure up when it comes to measuring the impact and value of the content you are publishing?
Chances are you are using Google Analytics to analyze your content marketing performance – and that is a great start. But Google Analytics is a robust, yet complex tool that offers plenty of insights beyond the basic site-visitor metrics that most marketers are tracking.
Consider this: CMI’s latest B2B Benchmarks, Budgets and Trends report found that only 30% of B2B marketers feel their organization is effective or very effective in its use of content marketing. And 34% don’t even have clarity on what success looks like.
With 52% of marketers also reporting that they feel challenged by the need to determine the ROI of a content marketing program, any data left on the table is a missed opportunity to understand how your content is affecting your audience – and your business’ bottom line.
If you aren’t familiar with, or aren’t actively tracking, data like what Orbit Media co-founder Andy Crestodina has outlined in our new e-book: How to Apply Analytics Data to Make Better Content Marketing Decisions, you could be overlooking the critical insights you need to optimize your content for greater success.
How to turn data into decisions
In his top-rated presentation on applied analytics at Content Marketing World 2015, Andy asserts that the best way to use analytics is as a decision-support tool – a way of answering your key questions about what’s working, how well it’s working, and what actions you should take as a result. To do this, he uses this simple, five-step process:
.@crestodina says that the best way to use #analytics is as a decision-support tool via @cmicontent Click To Tweet- Formulate an idea about your content performance.
- Determine a question you can ask to support this idea.
- Create the report that will provide the appropriate data to answer that question.
- Take action based on your analysis of that data.
- Measure the results of the actions you take against the baseline data you initially gathered.

RECOMMENDED FOR YOU:
4 reports to rule them all
When using Google Analytics as your data source for this process, there are four categories of reports you can view – each one is the key to understanding certain insights that impact the performance of the content marketing on your website:
- Audience reports: Understand who your audience members are, what their content interests are, and how they interact with the content you publish.
- Acquisition reports: Glean insights on the search terms visitors are using to discover your content, and the specific sources of your traffic.
- Behavior reports: Evaluate the actions of your site visitors, uncover ways to improve their user experience, and optimize the engagement potential of your content.
- Conversion reports: Determine if your content is helping your business achieve its marketing goals, and discover which content efforts are achieving the best results.
Take a look at just a few of the questions these four reports can answer, along with some tips that Andy offers for analyzing and applying their insights:
Use Data to Help Your Engagement Conundrum
Performance by platform
Question: Are mobile visitors less engaged than visitors on other platforms?
Report to generate: Mobile Overview (Audience >> Mobile >> Overview)
The Mobile Overview report shows the number of sessions (visits) from a mobile device. By clicking on the Comparison View button in the options selector, you can clearly see how mobile visitor sessions compare to other platforms in terms of the engagement metric you prefer – such as bounce rates, pages per session, or average session duration.
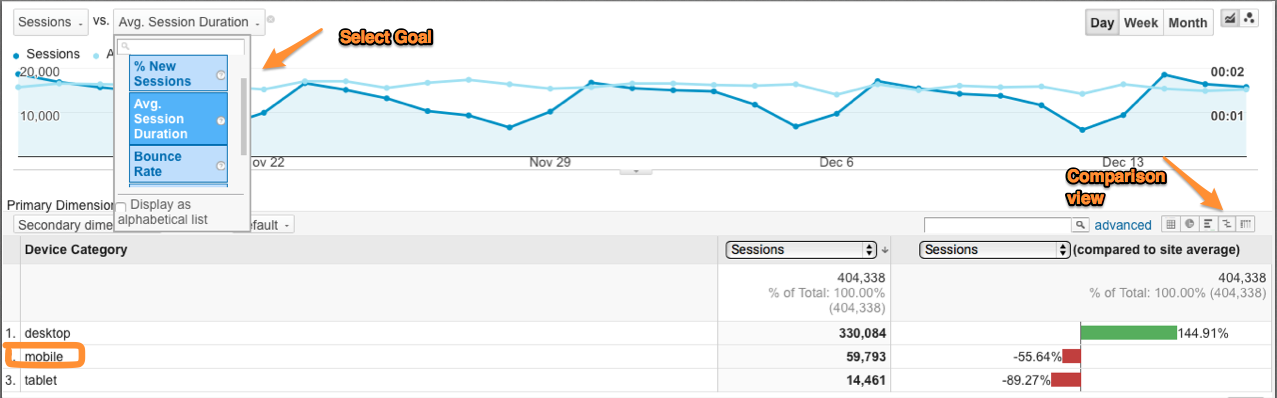
Click to enlarge
Sample analysis: If your bounce rates are extremely high among your mobile users, it could mean you need to better optimize your site’s user experience on mobile.
Suggested actions:
- Create a schedule for regular mobile testing.
- Check the design of your website landing pages to see if they are optimized for mobile visitors.
Social media traffic
Question: Which social network drives the best traffic to our site?
Report to generate: Channel reports (Acquisition >> All Traffic >> Channels, filtered by goal)
When considering traffic from your social networks, the “best” channels are those that convert visitors at a higher rate. You need to view the data that relates to the specific conversion goals. As you can see in the sample report below, LinkedIn had the highest conversion rate of the four most popular social channels.

Click to enlarge
Sample analysis: Once you set up your conversion goal in Google Analytics – subscribing to your newsletter, downloading an e-book, completing a lead-gen form, etc. – this report provides data on how successful your content is at meeting that goal.
Suggested action:
- Adjust your content resources to place a greater focus on creating content for the social channels converting at the highest rates.
Blog post engagement
Question: Which of our blog posts are the most engaging to visitors?
Report to generate: All Pages Report (Behavior >> Site Content >> All Pages)
If your site page URLs are categorized by content type (e.g., if the word “blog” appears in the URL of every blog post), you can use the search filter on the All Pages report to view only the data related to your blog posts. Then, click on Comparison View to see relative engagement data for your blog posts.

Click to enlarge
Suggested actions:
- Use high relative engagement to discover the topics that visitors find most engaging – indicating that you should create more content on those topics.
- Link from high-traffic posts to high-converting posts.
Go forth and analyze
Remember: Tracking and analyzing your performance data is not a one-time task. You need to revisit these reports on a regular basis to ensure that the actions you take are producing positive results and are accounting for any new trends and tactics that may impact your content’s performance.
For a more detailed explanation on analyzing and applying the insights found in these reports – as well as the additional performance questions Andy addresses, in each of the four categories – download the complete e-book, How to Apply Analytics Data to Make Better Content Marketing Decisions.
Want to stay updated on the latest analysis trends and CMI e-book releases? Subscribe to CMI’s blog posts.
Cover image by Joseph Kalinowski/Content Marketing Institute
Please note: All tools included in our blog posts are suggested by authors, not the CMI editorial team. No one post can provide all relevant tools in the space. Feel free to include additional tools in the comments (from your company or ones that you have used).
