
At least eight of every 10 pieces of content flatline when it comes to generating web traffic – often the goal of many content marketing campaigns. So, how well do your pieces of content perform? It’s possible to leverage your analytics to measure, improve content performance, and create content that drives better web traffic.
Most publishers and marketers only look at general, site-level trending graphs to see how content performs. This single measurement approach is not only misleading, but it will not work if you’re serious about improving content performance. You have to think about content performance with a decent level of granularity and precision.
Define content performance
To leverage data and drive superior content performance, you must articulate what a “high-performing” piece of content is from an analytics perspective. First, define what you want the content to do, such as:
- Drive strong traffic (measured in terms of page views, unique visitors, etc.)
- Drive strong engagement (measured in terms of conversions, social actions, etc.)
- Reach a defined audience
- Achieve its performance goals via sustainable traffic – a combination of organic (search engine), direct, social traffic, etc.
- Generate traffic within a certain time frame
For example, an online job-search company creates a steady stream of high-quality content hosted on its website because it wants the content to drive new and existing users to its site, and convert viewers to use its online offerings. It creates robust evergreen content to explain the company’s offerings, educate its audience, and drive sustainable traffic over a long period. Now, let’s look at two articles and their performance evaluation:
The article Common Java Interview Questions and Answers is a piece of high-performing content. It generated thousands of referrals in its first couple months and tens of thousands of referrals each subsequent month in its first year of publication. The content has generated over 150,000 referrals to date, a home run for this online job-search company.

In contrast is this article, Researching a Company Before an Interview, which was published at the same time. It generated only 10 referrals in its first few months, followed by a similar low level of activity. Over a year, this content generated 26 referrals. By any measure, this is low-performing content and a performance profile to be avoided.

Knowing what defines success in explicit terms, with the specific metrics that matter to you, is the first step in preparing yourself to further leverage data in content creation.
By identifying and reviewing these profiles, we now know high-performing content for this online job-search company can generate over a thousand referrals in its first month and 10,000 referrals a month within the first quarter, and sustain that level of traffic generation. Low-performing content can’t break 100 referrals over 12 months. Understanding your content-performance thresholds puts you on track to leverage data and gain insights.
Evaluate your content performance
Once you understand your analytical definition of high- and low-performing content, you can apply these thresholds to each piece of content. This will give you a great overview and baseline. In our experience, there is far more low-performing content than people typically acknowledge.
First, list all the content you created in the last six months with traffic data (organic referrals and total page views) for each item. Then, separate the content into performance categories based on a traffic-specific metric. (Organic traffic is a good one to start with, but you can use any metric that works for you.)
For example, consider three categories: top 25%, top 26-50%, and 51+%. You can easily calculate average traffic performance for each category. This typically reveals deep insights in terms of how much of your content truly drives results.
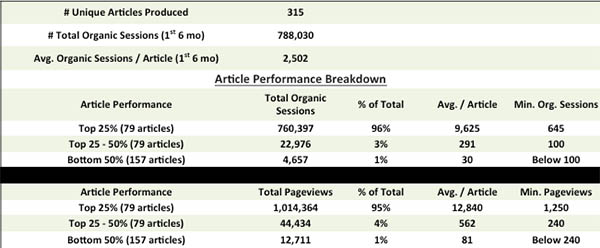
In the case of the online job-search company, we analyzed the first six months of traffic for 315 recently published articles. A new piece of content would need at least 645 organic sessions to qualify as a top 25% performer of organic traffic (1,250 for page views). Conversely, a piece of content that failed to drive at least 100 organic sessions would fall in the bottom-half category (below 240 for total page views).
The results were instructive. Content in the top 25% drove 96% of organic traffic and 95% of page views, whereas the bottom half (157 articles) drove little traffic in aggregate and on average.
Upon completing the performance analysis, it can be helpful to dig deeper to evaluate why certain pieces of content were more effective than others. But the end results don’t change. The top quartile drives the vast majority of traffic, while the bottom 50% typically yields little.
Now that you have a solid baseline on how your content performs, you can pilot data-driven techniques, measure against this baseline, and assess the impact with precision and confidence.
Get started even if you’re not a data geek
While this approach might seem different, it really isn’t that hard to do. Here is guidance to put content-specific performance evaluation approaches into practice:
- Access data: Collect the URLs for each new piece of content. Use your web analytics for each URL to find the appropriate monthly metrics (page views, visits, search traffic, etc.)
Note: While getting the data isn’t a herculean task, it’s typically not as simple as hitting a button. For example, in Google Analytics, go to the screen that lists traffic data by URL, and download (via the “export” feature) the requisite data to a spreadsheet that can be can be easily sorted, categorized, and analyzed.
If you are unfamiliar with this data or system, work with the person who set up your analytics software and you should be able to accomplish these steps without too much trouble.
- Be fluent: Review the data and understand what it means, especially because definitions can change. Review the baseline data and reports weekly and monthly. By reviewing it regularly, you will become more comfortable with it. You will start to internalize the data, seeing trends and patterns that make sense to you.
- Share with colleagues: Creating great content and web traffic is a team sport. Share your content-specific analysis with your colleagues. Show them how their content is doing. Share with them the insights and observations you have picked up. As your team becomes more comfortable with the analytics and insight, it gets that much closer to making data a regular part of how you develop content.
Don’t forget the why
When you wrap your arms around content-specific performance analysis, you will start to wonder how to improve those metrics. This is the “magic moment” – now you are ready to apply data-driven techniques in a meaningful and measured way to influence results, both in numbers and in the development of your relationship with your target audiences. Part of avoiding the Big Data hype is understanding how to leverage data without letting it overtake the content-creation process. You need to avoid losing sight of why you create content in the first place.
Want more instruction on how to manage today’s biggest content marketing challenges? Sign up for the Content Marketing Institute Online Training and Certification program. Access over 35 courses, taught by experts from Google, Mashable, SAP, and more.
Cover image by PublicDomainPictures via pixabay
