
Updated Aug. 5, 2020
Google ranks your most popular pages for dozens, if not hundreds, of search terms. Even if you target some of those keywords, you probably don’t know all the terms attracting attention from search engines.
But a free tool – Google Search Console – can help you identify these “hidden” keywords and further optimize your content. Follow this easy-to-implement, seven-step process to develop a strategy that could bring in thousands more visitors every month.
Let’s start with the basics.
Over time, Google’s algorithm ranks each page for terms it thinks are relevant to the content. You can access those conclusions through the free Google Search Console. (If you haven’t already connected your site to your account, begin that process here.)
HANDPICKED RELATED CONTENT:
1. Get the big and little picture
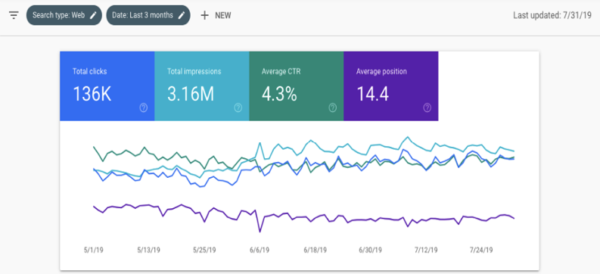
You arrive at the overview screen. Click on the Performance tab in the left column to see an overview of your site’s performance, including:
- Total clicks
- Total impressions
- Average click-through rate (CTR)
- Average position of your site (based on its highest position whenever it appeared in search)
TIP: The default view of the graphic (below) includes only total clicks and impressions. To see average CTR and average position in the graph, click on its corresponding box above.
Below the overview graphic is a table with the site’s individual pages. Analyzing this information provides valuable insights about your content.
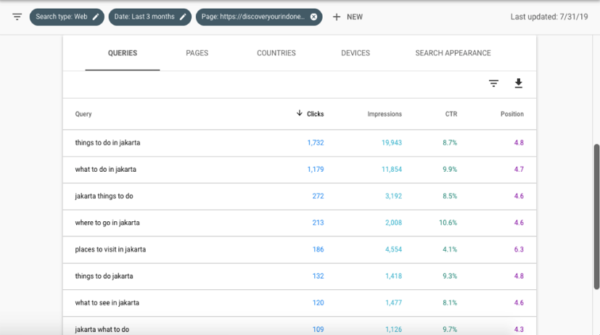
The tabs – queries, pages, countries, devices, and search appearance – allow you to analyze the data points (clicks, impressions, CTR, position) in different ways. Here’s a quick overview of the tabs:
- Queries – all your ranking search terms
- Pages – list of pages on your site
- Countries – origin of visitors on your site
- Device – how people interact with your site across mobile, desktop, tablet
- Search appearance – inclusion in elements like rich snippets and accelerated mobile platforms (AMPs)
TIP: The default setting for sorting is bolded on the page. Click on a different header (e.g., Impressions instead of Clicks) to sort the pages by that measure.
Now let’s jump in to how to evaluate this data. It involves spreadsheets, custom formatting, and a bit of color coding.
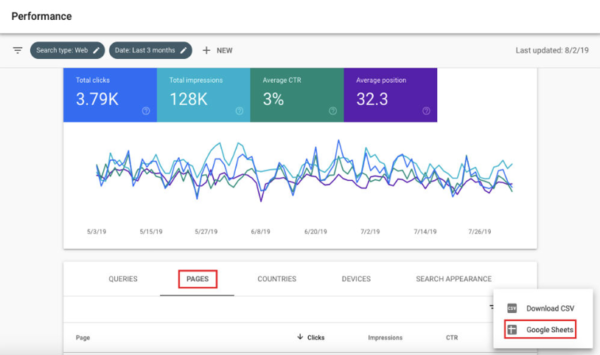
2. Export page keywords to Google Sheets
To understand which keywords your content is ranking for, review each page’s analytics individually.
Select the Pages tab and export the data to Google Sheets. You now have the aggregate overview of each page’s appearance in search results.
Now, identify which pages have the biggest impact on traffic by using the sort feature in Google Sheets:
- Highlight columns A to E.
- Click Data in the menu.
- Select Sort the range.
- Click Data has header row.
- Select Impressions.
- Choose Z to A.
- Click Sort.
Here’s a screenshot of what you should see when you have followed all these steps.
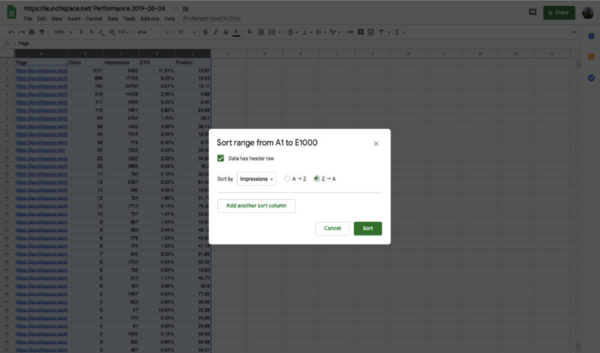
Now you can see your site’s individual URLs ranked by the number of impressions (high to low). The pages at the top have the most potential to bring more traffic with further optimization.
Select your top 20 pages by impressions.
TIP: Only pick content-focused URLs – most often these are articles from your blog. You can’t optimize your boilerplate pages, such as the Contact Us page, in this exercise.
HANDPICKED RELATED CONTENT:
3. Download the keywords
Now, let’s analyze the keywords for each of those 20 pages.
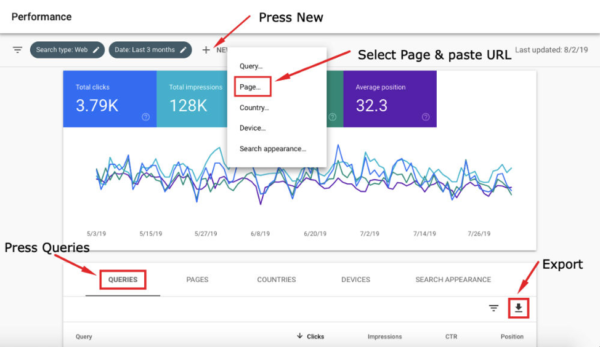
Go back to Google Search Console to collect this data:
- Click the new button and select page.
- Paste the first URL into the lightbox. Click apply.
- Select Queries from the table menu and click Export to Google Sheets.
In your exported Google Sheet, sort the queries by impressions (see the sorting instructions in the previous step for a refresher on how to do this).
Repeat this step for each of the 20 URLs. Your master Google Sheet should now have 21 tabs.
4. Apply conditional formatting
Conditional formatting is a set of rules you can use to analyze data on a spreadsheet. Use it to identify keywords you want to focus on.
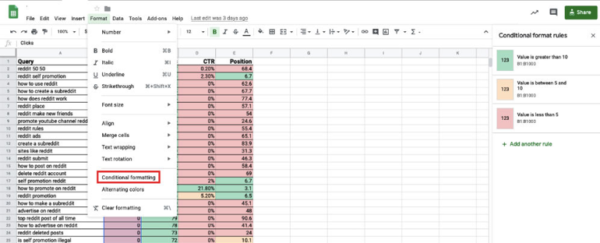
For example, I applied this formatting to the average position column with the following conditions:
- Highlight rows with average position of 10 or lower in green.
- Highlight rows with average position between 11 and 20 in yellow.
- Highlight rows with average position 21 and higher in red.
You can apply conditional formatting to a column or a single cell. Select Format on the main menu and click on Conditional formatting.
I applied a similar set of relevant rules for each of the four columns detailing the metrics. Access this template, which already includes these rules (i.e., conditional formatting) for your analysis.
5. Analyze the results
The spreadsheet now colorfully displays your keyword and content opportunities using a traffic signal approach. Look at the green opportunities first, followed by yellow and finally red.
Take time to review the analysis to look for effectiveness of your targeted keywords, surprising keywords, patterns (e.g., high impressions but low CTR), etc.
Let me give you two examples of how you might use the information:
- If a phrase is ranking on the first page and has a high number of impressions but a low CTR, optimize the page’s metadata to attract more clicks.
- If a phrase in Position 21 or higher has a high number of impressions but a low CTR, increase the keyword density in the existing content. (Don’t just stuff the keyword into your content as many times as possible. Look for opportunities to include it organically. For example, instead of using the pronoun “it,” use the keyword.)
6. Update your content and SEO plans
Now, it’s time to update your metadata and existing content to incorporate the high-ranking terms you have identified. Rather than rehashing how to do that here, I recommend you check out the following resources:
- The Essential Guide to Meta Descriptions That Will Get You Found Online
- The Why, When, and How of Republishing Blog Posts
- Rise Up in Google SERPs With the Right SEO Website Content
That brings us nicely onto the final phase of how to use Google Search Console for SEO.
7. Review the SEO impact of your updates
Updating old content and improving the metadata of your content is an ongoing process. Get into the habit of reviewing the impact of your post-analysis change. Ideally, do it two weeks after you update a metadata description and three months after you change the existing content.
Review 2 weeks after you update a metadata description & 3 months after changing existing #content, says @nhdprins via @CMIContent. #SEO Click To TweetGo to Search Console and choose a page to review. Then select Date range followed by Compare.
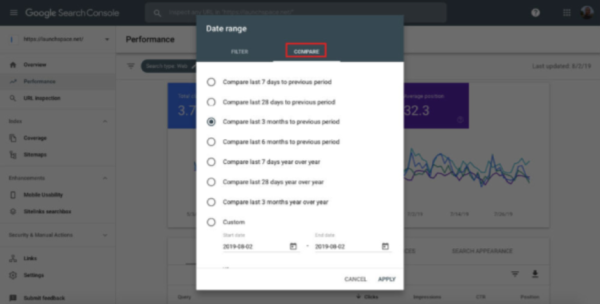
You can analyze the data in Search Console or export it to a Google Sheet. If you see an increase in position, CTR, or number of impressions, your changes likely had a positive impact. If you see no change or a decrease in those metrics, you should tweak the metadata or make changes to your content.
Investigate and use the data
In this guide to using Google Search Console for SEO, I sought to provide a data-driven framework for reviewing and optimizing your existing content. It’s a system that covers how to find keywords that you probably weren’t even aware you were ranking for, how to identify the most relevant terms, and finally, how to review the results of your updates.
Let me know how your analysis and implementation goes. If you have any questions about anything covered in this post, let me know in the comments.
Please note: All tools included in our blog posts are suggested by authors, not the CMI editorial team. No one post can provide all relevant tools in the space.
Cover image by Joseph Kalinowski/Content Marketing Institute
