
 Although Google Analytics default metrics are valuable, they don’t allow you to get answers to deeper questions about your content: Do visitors like the content? Do they read the article until the end or just the first sentence? Which author generates the highest number of conversions? How long do visitors watch the videos?
It doesn’t have to be like that. Let’s explore five ways to enhance your content performance measurement with custom (and often easy-to-create) Google Analytics tracking.
HANDPICKED RELATED CONTENT:
1. Install scroll tracking on your article pages
Usually, when visitors like what they read, they scroll until the end of the article. Measuring scrolling action can be an indicator of whether visitors like the content. Google Tag Manager has a built-in trigger for scrolling.
Set up trigger in @Google Tag Manager to know how far a visitor scrolls down the #content, says @Analytics_Help via @cmicontent. #analytics Click To TweetTo set it up, create a new Trigger Type – Scroll Depth. Set the Vertical Scroll Depths to “0,25,50,75,100” in the percentage field as shown in this image:

Click to enlarge
With this setup, the scroll trigger is fired when the visitor is at the top of the page (scrolled 0%), when the visitor scrolls through one-fourth (25%), one-half (50%), three-fourths (75%), and reaches the bottom of the page (scrolled 100%).
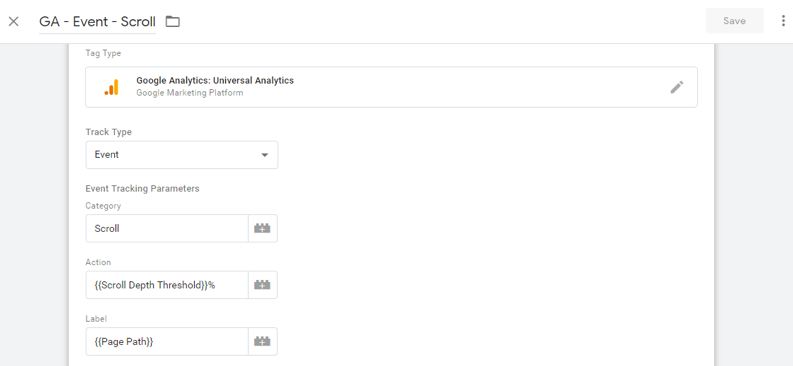
After this, create a new Google Analytics tag (in this example, I call it GA – Event – Scroll) and set the Track Type as Event. In the Category field, enter the event category as it will appear in Google Analytics event reports. In this example, I chose “Scroll” for the event Category.
In the Action field, select the {{Scroll Depth Threshold}} variable and add the percentage sign “%” at the end of it. In the Label field, add the {{Page Path}} variable.
Click to enlarge
Next, select the Google Analytics variable that contains the property ID (the unique Google identification for the website). Set the newly created Scroll trigger as the tag trigger, save it, and publish the changes.
With this tracking installed on your site, you can analyze how many visitors scroll and how far they scroll on a blog post. As discussed earlier, this metric can indicate how well your audience likes that blog post.
![]()
Click to enlarge
2. Track video usage
What do visitors think of your videos? Do they actually view them? Do they just skip to the text below them? Without video tracking, these questions are hard to answer. Fortunately, just as with scroll tracking, Google Tag Manager offers a solution for YouTube videos built into your site.
Create custom @GoogleAnalytics to identify performance factors of embedded #YouTube videos, says @Analytics_Help via @cmicontent. #analytics Click To TweetFirst, enable the video variables, then create the firing trigger and, lastly, create the tag that sends the data to Google Analytics.
Let’s walk through those steps. From the built-in variables, enable Video Status, Video Title, and Video Percent.

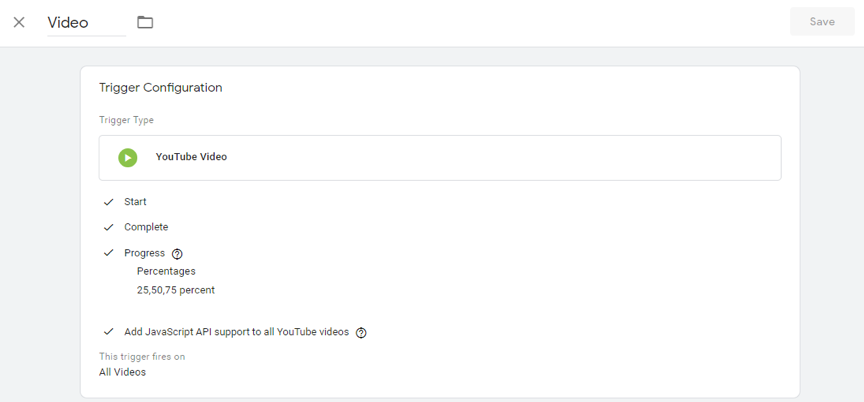
After this, create a video trigger that fires on user interactions. From the trigger menu, click on New and select YouTube Video as the Trigger Type.
Click to enlarge
Then, select Start, Complete, Progress, and Add JavaScript API support options. Save the trigger.
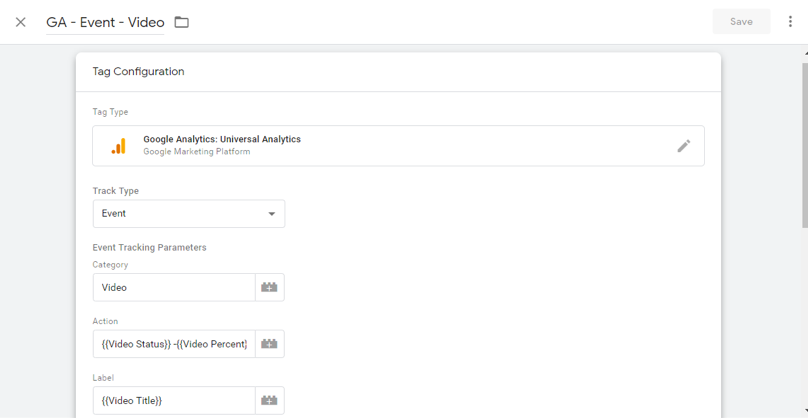
Next, from the tag menu, click on New and create a Google Analytics tag type that will send the video usage data from your property to your Google Analytics account.
Click to enlarge
Next, choose Event as the Track Type. In the Category field, add Video. In the Action and Label fields, enter the newly enabled built-in variables: Video Status, Video Percent, and Video Title.
After this, set the Video trigger created in the previous step as the tag firing trigger and save the tag.
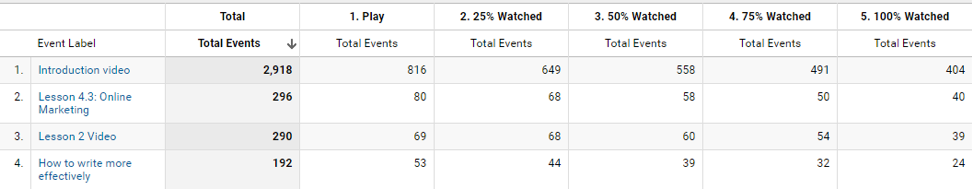
Now, every time a visitor plays a YouTube video on your site, the relevant data will appear in your site’s Google Analytics.
Click to enlarge
TIP: If you use non-YouTube-embedded video formats, look at their video tracker installation information to evaluate the possibilities of understanding viewership of embedded videos on your site.
HANDPICKED RELATED CONTENT:
3. Track clicks on social share buttons
Clicks on social share buttons is another metric that helps uncover which articles or topics suit your audience, as users usually share the articles they like.
Many social share plug-ins offer Google Analytics integration (often visible as a conversion event as shown on my company’s site). To enable this tracking, check the documentation of your share-button provider.
You likely will find a correlation among the number of shares, the percentage of visitors who scrolled to the bottom of the page, and the average time on page. If your share numbers are significantly lower than the other two metrics, that could indicate a design malfunction with the sharing button. Run some A/B social share tests to evaluate placement and usage.
HANDPICKED RELATED CONTENT:
4. Collect post author and its category
If multiple people author articles on your site or you cover multiple topics, tracking post authors and categories can provide valuable information. You can learn who are the top- and poorest-performing authors. This data will let you provide valuable feedback to the authors and identify which writers are most suitable for your audience. Author data is not a default Google Analytics metric, but you can create a custom dimension for each page view to assess this. (Google explains how in the example at the end of this page.) Given that this customization is more technical, you may find it helpful to ask for help from a Google Analytics expert.
Track authors and topics to see which ones resonate the best with your audience, advises @Analytics_Help via @cmicontent. #analytics Click To TweetCategory monitoring lets you see which topics resonate better with your audience. Depending on the URL structure of your blog, you can use content grouping – define a rule that extracts the category from the article’s URL.
5. Track comments
As with the previous user actions, a visitor who comments on a blog post can be a sign of engagement. Tracking this behavior is yet another way of measuring how engaged users are with the content.
You can use Google Tag Manager to set up this custom analytic, selecting Comments Submission as the Event Category. However, the additional setup steps may vary depending on the type of comments platform used. This article goes more in depth on those specifics. You also can look to your CMS platform instructions for guidance.

Click to enlarge
Take the time to customize metrics
While this article delves into the how-to, this infographic can be a helpful reminder of the five custom tracking options for better content management.
![]()
By knowing how much visitors read, viewers watch, users share, and readers comment along with what topics and authors are most popular, you can improve your content creation plans and get better results.
Dig into the tech side of content marketing this August in San Diego. Join us for ContentTECH Summit. Check out the agenda today.
Cover image by Joseph Kalinowski/Content Marketing Institute
