 In today’s post-literate world, visual content makes it possible to convey complex information in a variety of concise, understandable, and colorful formats that aren’t possible using words alone. Adding visual content to your blog content is a powerful way to get the attention of your readers and differentiate your thinking from competing bloggers in your niche.
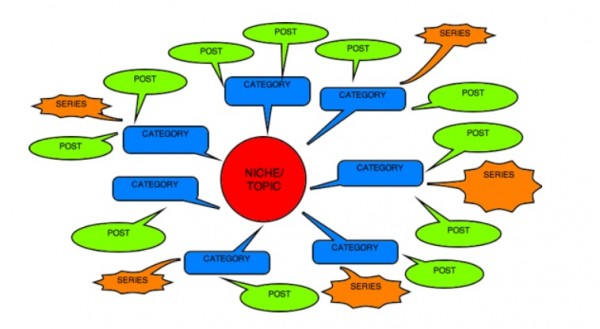
In particular, mind maps are one form of visual content you should consider adding to your blog. They typically consist of a central topic with branches containing key words and concepts radiating out in all directions. Remember the hierarchical outlines you did in primary school? Mind maps are a visual version of them.
Mind maps are growing in popularity because they match the way our brains work — by association. They enable us to translate our thinking into a more tangible form, so we can expand upon our ideas, refine them, and use them to get things done. They are also powerful ways to communicate ideas and concepts to others.
Within the context of a blog, mind maps represent distinctive content objects that command attention and get readers thinking. The position of topics and subtopics conveys both meaning and context; these visual communication tools can be embellished with images, icons, and other supporting information to further increase their value. When converted into images, they can be shared on a variety of social media channels. This makes them an ideal form of visual, shareable content that you should consider adding to your repertoire.
Here are 5 ways in which you can employ mind maps to create more powerful blog content:
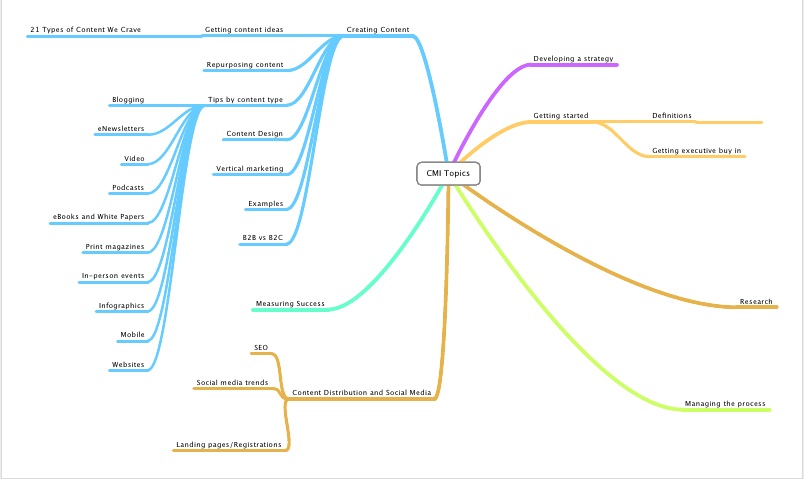
1. Resource maps
Create a collection of resources on a topic that’s of interest to your readers, with links to web pages where they can learn more. This type of map image includes a set of links embedded in it, so that when readers click on a topic, their browser takes them to the corresponding web page. Here is an example:

Note that the topics in the image displayed in this blog post do not contain links; that’s because WordPress will only allow you to assign one URL to each image. You need to click on the image, which will take you to a separate HTML page that contains the hot-spotted version.
This type of interactive mind map can be created in two steps:
- Create your visual map in your favorite mind-mapping program and export it as an image file.
- Open it in an image editing program that allows you to create hot spots and add links to them (my program of choice is Adobe Fireworks).
If you don’t want to manipulate an image, you can simply generate a jpeg, gif, or png image of your mind map — sans links — and then include the links and resource descriptions in the body of your blog post, as I’ve done here:

2. Solicit reader feedback on an info product idea
One product development technique that bloggers are starting to use is crowdsourcing: posting an early prototype of an information product on your blog to solicit reader feedback on it. You can present a mind map that showcases the topics and issues you plan to cover in your info product, and the sequence in which you plan to do so.
Doesn’t this potentially expose you to rip-off artists, who may try to use your outline to beat you to the punch? Technology guru Guy Kawasaki, in his new Kindle book “APE: Author, Publisher, Entrepreneur,” describes how he posted an early outline of it online and asked for feedback. He says the input he got was so valuable that it was well worth the risk. He also believes it resulted in higher book sales, because so many people felt a sense of “ownership” in the book when it was published.
3. Create a small collection of quotes or life lessons
Using this technique, you can copy and paste favorite quotes or life lessons from someone you admire into a mind map. This takes a list of fairly mundane, text-based pieces of information and transforms it into something beautiful and inspiring.
Be sure to include an iconic image of the person as part of the central topic — especially if your subject is someone famous. This will create significantly more visual interest than a text-only central topic. Then export your mind map as an image, as described in the first technique.
This approach creates a content object that has lots of “legs” compared to a simple text list of 8 to 10 quotes or life lessons. You can post your map image to Pinterest and Instagram, share it on your personal or business Facebook page, refer to it in a Twitter post, and much more. Here are several examples:


4. Communicate information more clearly to your readers
Dissect an idea into its essential elements in a blog post, and use a mind map to visually support your analysis. This is an excellent way to expose your thinking to your readers in a colorful, impactful way.
Mind maps do an outstanding job of showing the relationships between your ideas — much more clearly than text only. First-level topics give your readers the bigger picture — the major parts of the idea about which you’re writing. “Child” topics branching off of them show the next level of detail. Their sequence, when read in a clockwise direction, gives your readers an intuitive grasp of how all of the pieces fit together. Here are several examples:

One consumer product company, Nestlé, has adapted the idea of a mind map to help consumers make healthier choices about the foods they’re buying, which it calls the Nutritional Compass. As the company explains on its Nutritional Compass web page, “The compass has always been treated as an essential navigation tool. It helps you know where you stand, decide where you want to go and find your way ahead.” By connecting the traditional table of nutritional information with more specific details on the food’s nutritional benefits and a tip on how to make healthier choices, Nestlé says the Nutritional Compass makes it easier for consumers to make more informed choices about the foods that families eat.

5. Visually explain a simple process
Although many mind maps are radial in design, with topics facing in all directions, they don’t have to be. You can create a right-facing mind map to visualize a simple business process. In this type of visual map, the timeline goes from top to bottom. In other words, the topic at the top is the first step in the process; the second one is the next step, and so forth. You can learn more about this technique here:

Tips for incorporating mind maps into your blog posts
If you decide to give one or more of these techniques a try, here are some tips to keep in mind:
If you don’t currently own mind-mapping software, Xmind and MindMaple are well-designed, easy to use, free programs that you can use to get started.
- The default setting of most mind-mapping software programs is to produce a simple black-and-white visual map. Explore your program’s settings to see what you need to do in order to add color to your mind map. Some programs include themes that you can apply to your maps to do this quickly. I like to use NovaMind to quickly generate maps with a rainbow of topic colors, using one of its built-in themes. Otherwise, you can color topics manually to meet your needs using your program’s topic formatting options.
- Use larger fonts in your mind map (14 points or more), so when you export it and resize it to fit within the layout of your blog, the text will still be readable.
- Most mind-mapping programs generate visual maps that are taller than they are wide. Plan to do some experimenting with positioning of topics and the distance between them to make your mind map more vertically compact. This will ensure that your readers can see both the map image and the first paragraph or two of your blog post “above the fold” (within the first screen-full of information).
- Each of these techniques requires that you export your visual map from your mind-mapping program to an image file, which you must then resize and crop to fit your blog’s layout. For best results, I recommend exporting to tiff, bmp, or png image formats, because they retain the greatest amount of image data. Exporting to jpeg or gif are not recommended, because these are compressed image formats that may appear jaggy when resized.
- When you’re formatting map images for your blog, create two sizes: One to fit within the standard layout of your blog and a second, larger image that readers can view to see more detail. For example, when I add such a map image to one of my blog posts, I generate one image that is 600 pixels wide (the full width of blog posts in the WordPress template I use); it appears along with my blog post. Within the WordPress image settings, I then link to a large version (900-1200 pixels wide) that will be displayed when the reader clicks on the smaller one. Be sure to include some wording in your blog posts that instructs your readers about this functionality — otherwise they may not realize it’s there.
- Consider adding your name, company, email address, and logo to your map image in an unobtrusive way. Why? Because of the growing popularity of image-oriented social media channels like Pinterest and Instagram, it’s likely that your most compelling map images will be shared by others in places outside of your blog. This will ensure that people who see your map image will know who created it — and may visit your blog to access more of your innovative thinking.
- Limit your mind maps to the high-level details of your blog topic. Too much information crammed into a visual map may make it hard to read and understand. If you must share something more complex with your readers, provide a simplified image of your mind map with the topics collapsed within a blog post, and link it to a PDF file that displays a more detailed version of it.
Looking for more ways to maximize the impact of your content by adding great visuals? Try one of these 27+ Handy Tools for Better Visual Content Marketing.
